Data Mining @ BCM
Part 5: Classifiers
This textbook is a part of the accompanying material for the Baylor College of Medicine's Data Mining course with a gentle introduction to exploratory data analysis, machine learning, and visual data analytics. Throughout the training, you will learn to accomplish various data mining tasks through visual programming and use Orange, our tool of choice for this course.
These course notes were prepared by Blaž Zupan and Janez Demšar. Special thank to Ajda Pretnar Žagar for help in the earlier version of the material. Thanks to Gad Shaulsky for organizing the course. We would like to acknowledge all the help from the members of the Bioinformatics Lab at University of Ljubljana, Slovenia.
The material is offered under Create Commons CC BY-NC-ND licence.

Concepts Covered
There are many different types of classification models, of which we have covered perhaps the best know and most different:
-
Logistic Regression – A classification method that predicts the probability of a data instance belonging to a class. It finds a decision boundary that best separates the classes and outputs probabilities using the logistic function.
-
Nomogram – A visual tool that helps interpret classification models by showing the importance of different input features and how they influence the predicted outcome.
-
Random Forest – An ensemble method that builds multiple decision trees, each trained on a random subset of data. The final prediction is made by majority vote, making the model more robust and accurate.
-
Support Vector Machines (SVM) – A classification method that finds the best possible boundary between different classes. It can also handle more complex data patterns by adjusting how data is separated.
-
k-Nearest Neighbors (k-NN) – A simple classification algorithm that assigns a class to a data instance based on the majority class of its closest neighbors.
-
Lazy Learning – A learning approach where the model does not build a classification function in advance but instead makes predictions by comparing new instances to stored training data.
-
Naive Bayes Classifier – A simple classification model that makes predictions based on probabilities. It works well for text classification and other tasks where features provide independent evidence.
-
Neural Networks – A machine learning model made up of layers of connected units (neurons) that process data. Essentially, neural networks combine many logistic regression models to learn complex patterns.
Chapter 1: Logistic Regression
Logistic regression is a well-known classification algorithm that estimates the likelihood of a class variable based on input features. To handle multiclass problems, it employs a one-versus-all technique, where it treats one target value as positive and the rest as negative, transforming the problem into a binary classification task. Next, it identifies an optimal decision boundary that separates instances with the target value from those without. This boundary is found by computing distances from the instances to the decision boundary, and then using the logistic function to transform these distances into probabilities. Instances that are far from the boundary are assigned a higher probability of belonging to the positive class, while those near the boundary are assigned probabilities closer to 0.5, indicating more uncertainty in the prediction.
Can you guess what would the probability for belonging to the blue class be for A, B, and C?
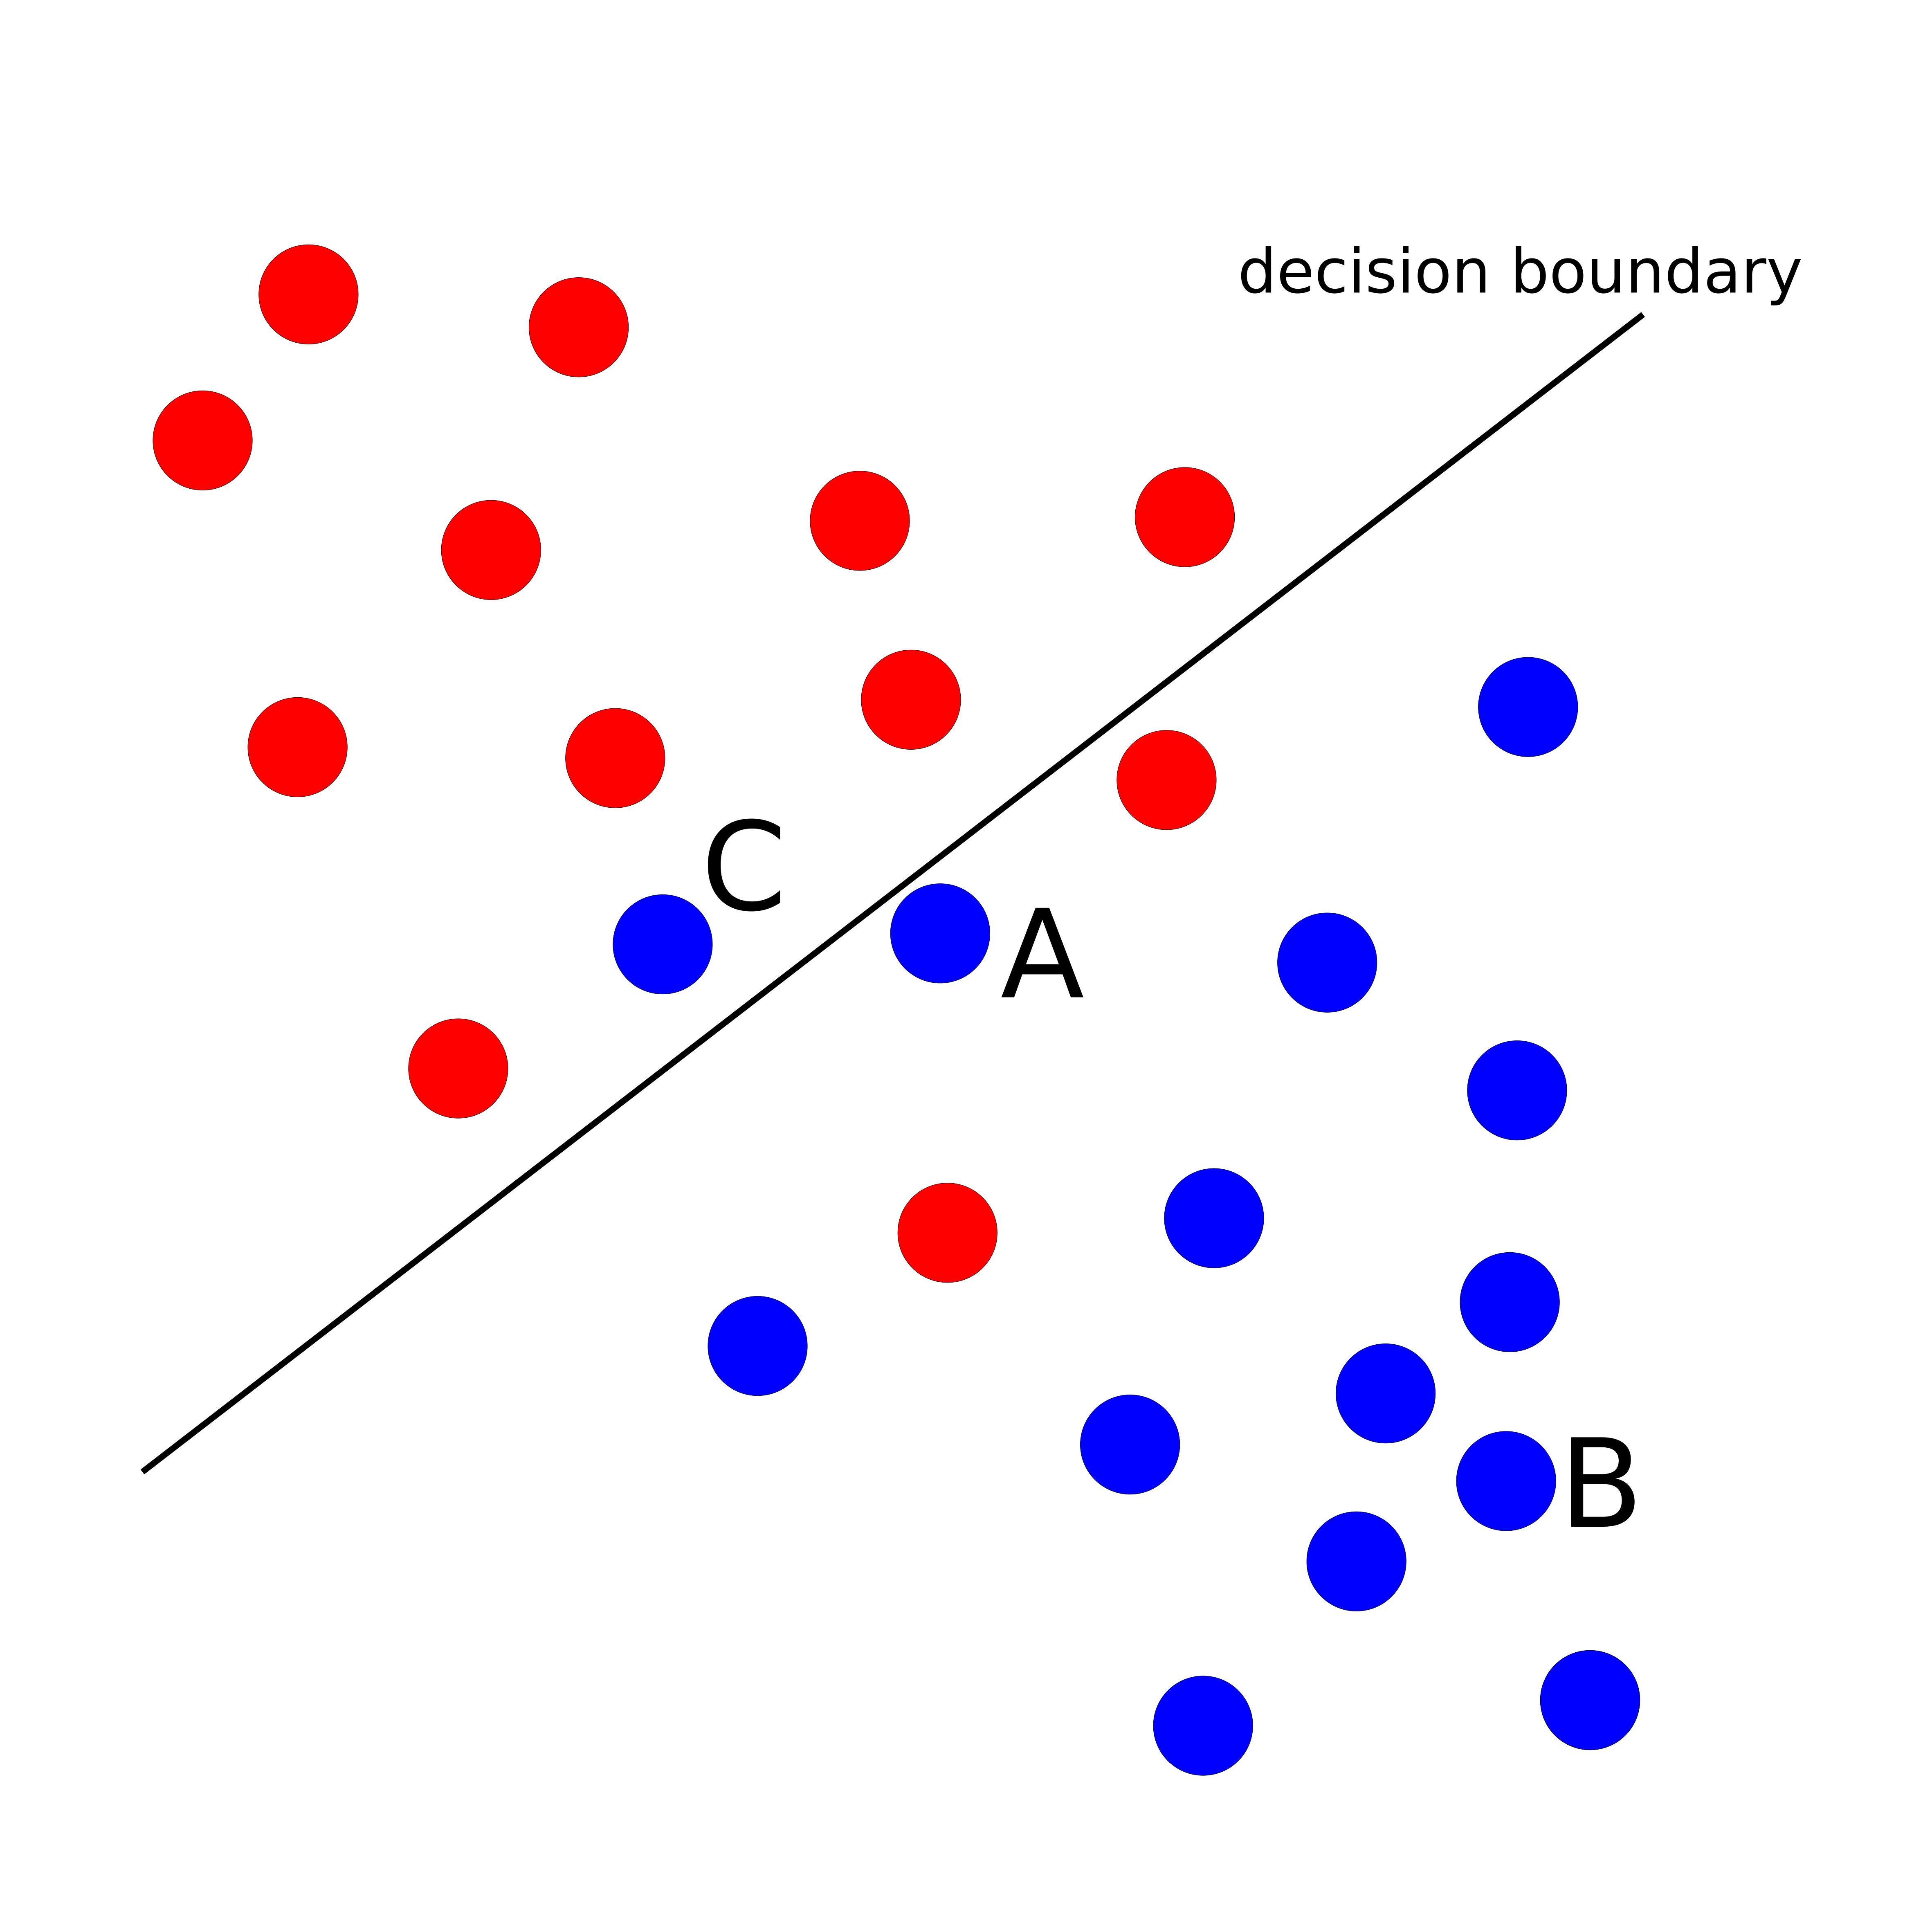
The goal of logistic regression is to identify a plane that maximizes the distance between instances of one class and the decision boundary, in the appropriate direction.
Logistic Regression widget in Orange offers the advantage of interpretability through the use of a Nomogram.

A nomogram displays the relative importance of variables in a model. The importance of a variable is indicated by its position on the nomogram: variables higher up on the list are more important. In addition, the length of the line corresponding to each variable indicates its relative importance: longer lines indicate more important variables. Each line represents the coefficient of the corresponding variable, which is used to compute the probability of the target class. By adjusting the blue point along a line, you can explore how changing the value of the corresponding variable affects the model's output, demonstrating the relationship between different input values and the predicted probability of the target class.
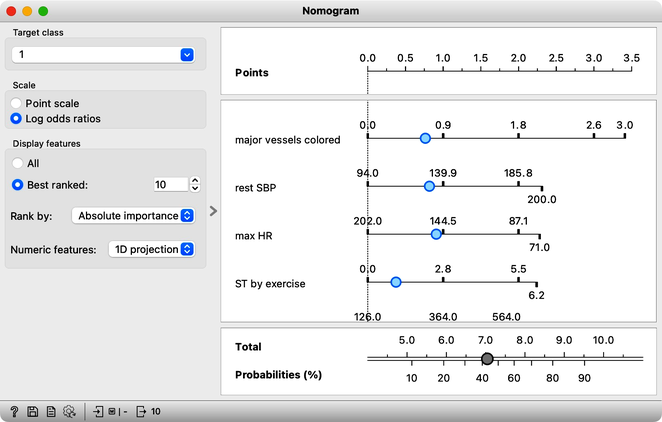
Logistic regression takes into account the correlation among variables when evaluating them simultaneously. In cases where some variables are correlated, their importance is distributed among them.
However, logistic regression has limitations as it relies on linear decision boundaries, which means that it may not work well for datasets that cannot be separated in this way. Can you think of an example of such a dataset?
Chapter 2: Random Forest
The random forest algorithm develops each tree on a bootstrap sample, which is a sample with the same number of instances as the original dataset. In a bootstrap sample, each data instance is drawn from the original dataset with replacement, creating a new dataset that includes approximately 63% of the original samples. The remaining 37% of the data instances can be used to estimate accuracy and feature importance.
Random forests, a modeling technique introduced in 2001, remains one of the most effective classification and regression methods. Unlike traditional decision trees that choose the feature with the best separation at each node, random forests build multiple trees using a random selection of features and data samples. This approach introduces variability in the tree-building process and can improve model performance. By randomly selecting among best-ranked features at each node, the models can account for interactions among variables and prevent overfitting. One way to visualize the impact of random sampling on tree structure is to use a tree visualization widget like Pythagorean Tree. By sampling the data with each tree construction, the resulting trees can vary substantially, allowing for greater model flexibility and robustness. We demonstrate this approach using a heart disease dataset.
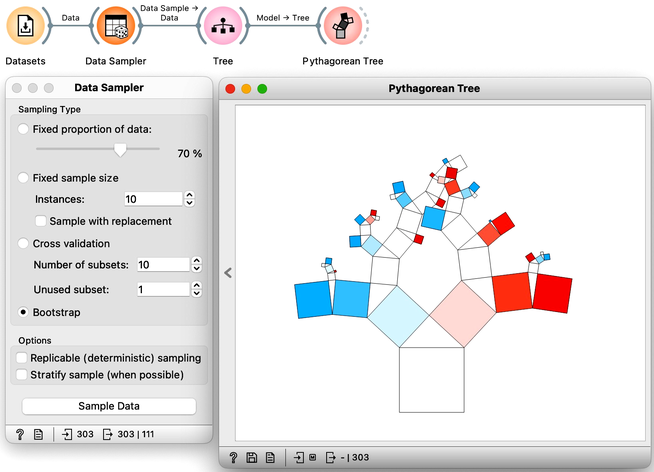
Random forest trees are generally quite diverse, and for the final prediction, the trees collectively "vote" for the best class. This voting process is similar to asking a group of people with varying levels of expertise to make a decision by majority vote. While some people may not have enough knowledge to make an informed decision and will vote randomly, others may have relevant knowledge that will influence the decision in the correct direction. By aggregating the results of many trees, random forests can incorporate the knowledge of a diverse set of models to make accurate predictions.
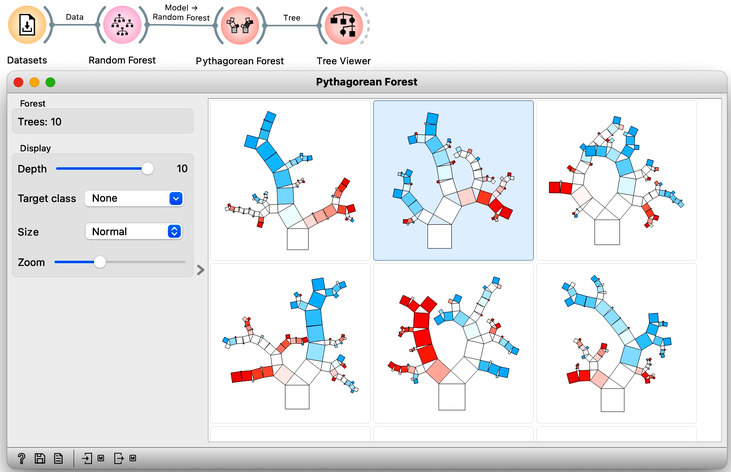
Interpreting a random forest model can be challenging due to the many tree models involved. Understanding which features are the most important in a random forest can be particularly challenging. Fortunately, the creators of random forests have defined a procedure for computing feature importances. This importance is assessed by measuring the accuracy of each tree on its out-of-sample testing data when the tree uses the original testing data or the data with shuffled values of a chosen feature. Features that have a large difference in accuracy are deemed more important. To obtain this ranking, one can use a Random Forest learner with a Rank widget. This approach can help users identify the most important features and understand how they contribute to the model's predictions.
Why do you think Random Forest does not need a connection from Datasets in the workflow on the right?
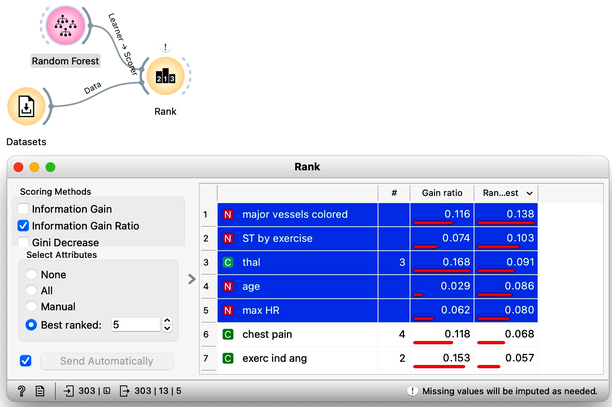
It is advantageous to compare the accuracy of random forests to that of classification trees. In practical applications, random forests consistently outperform classification trees in terms of precision and achieve higher classification accuracy.

Chapter 3: SVM

Linear decision boundary of a logistic regression classifier.
Support vector machines (SVM) are a type of linear classifier that are similar to logistic linear regression in that they seek to find a decision boundary to separate data instances of different classes. However, SVM can transcend the limitation of dividing the data by a simple plane by utilizing the "kernel trick." This method involves transforming the hyperplane, or decision boundary, to a higher-dimensional space that includes additional features beyond the individual ones, such as their products and other combinations. This approach allows SVM to fit the data more effectively and separate the classes with a linear hyperplane, making it capable of functioning as a non-linear classifier and fitting more complex datasets.

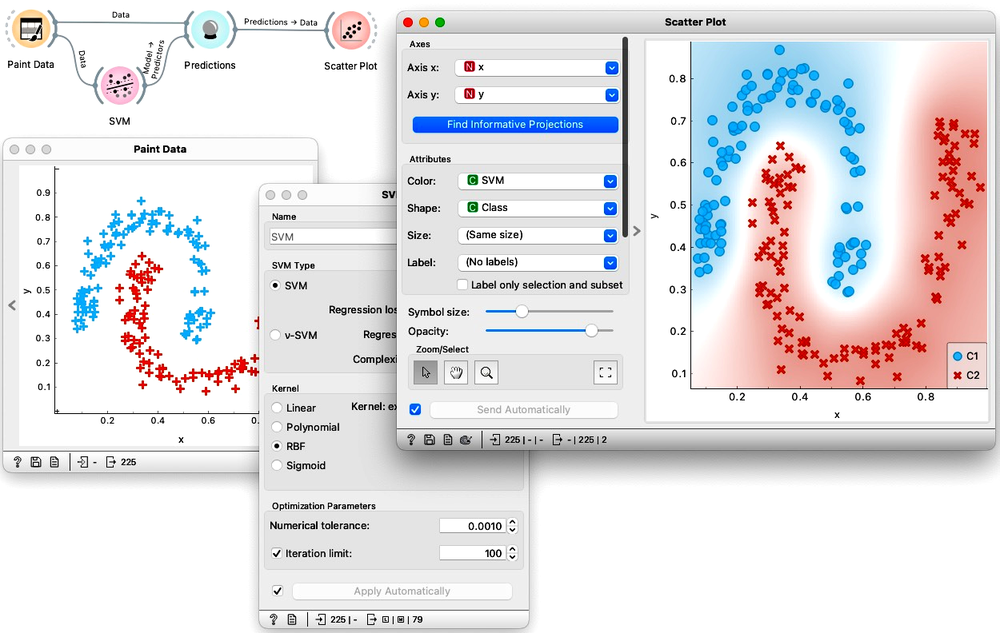
Decision boundary of a support vector machine classifier with an RBF kernel.
SVM, along with other kernel methods, possesses the ability to implicitly discover a transformation into a usually infinite-dimensional space, in which the kernel specifies the distances between objects and where a linear hyperplane can be drawn. In practical terms, SVM can split the data using more complex structures than conventional linear hyperplanes by employing various kernels. The complexity of the resulting structure is determined by the kernel type and algorithmic parameters, such as the type of combinations of original features and new coefficients, as well as the penalty for misclassifications.
In the workflow below, we painted a data set and intentionally introduced two classes that cannot be separated with a linear plane. We fed the data into the Predictions widget, and provided it a classifier developed on the same data set. Notice that here we were only interested if the SVM can develop a suitable decision boundary. And obviously it can. Scatter Plot shows that SVM correctly classified all of the data instances in the training set and, as estimated with a white area between blue and red regions, it inferred a non-linear classification boundary.
Chapter 4: k-NN

For an data instances to be classified, kNN looks at its k nearest neighbors. Here, we set k to the value of 5. Of these five neighbors, four belong to the red class and one to the blue class. Our data instance will thus be classified as red with 80% probability.
The concept of k-nearest neighbors (kNN) is straightforward: find the k instances that are most similar to each data instance, and then make a prediction or estimate probabilities based on the classes of these k instances. In the case of classification, the final label is determined by the majority label among the k nearest instances, while for regression, in the cases where we would predict the value of a continuous class, the final value is the average of the values of the k nearest instances.
Unlike many other algorithms, k-nearest neighbors (kNN) does not build a model but rather in the training phase just stores the training data. This type of learning is referred to as "lazy learning." The kNN algorithm's main advantage is its ability to accurately model data that cannot be linearly separated into classes. Moreover, it can be rapidly retrained since new data instances only impact the model locally. However, the classification, that is, the stage when we use the model to predict a class, may be slow for large datasets, as the model must estimate all distances for each new data instance to be classified.
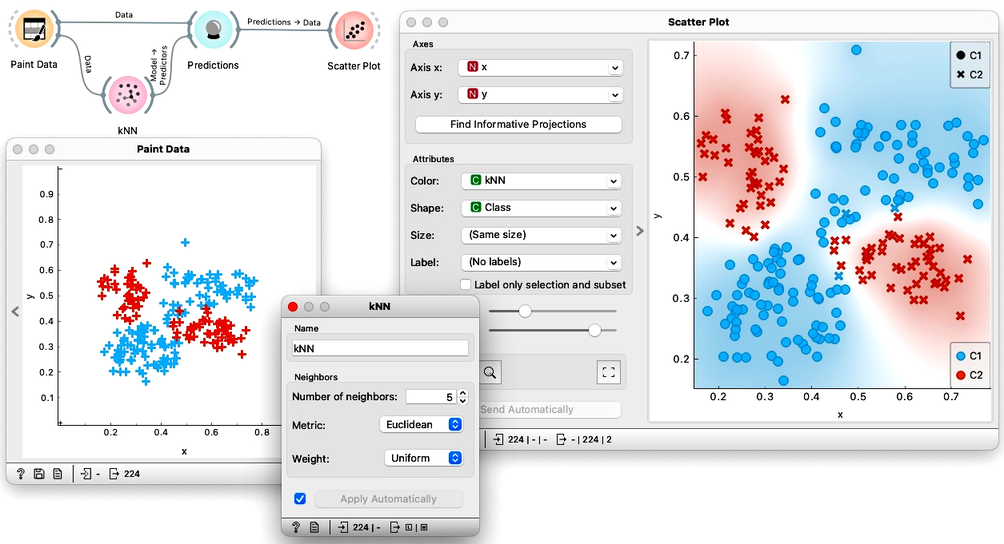
Below, we tried to paint a data set where linear classifiers such as logistic regression would fail but where kNN may succeed. Indeed, kNN was able to correctly classify most of the data instances from the training set. How many training data instances were misclassified?
Chapter 5: Naive Bayes
The naive Bayes classifier assumes that the features are independent within each class. If a dataset were to have truly independent features, then the naive Bayes classifier would be the optimal choice. However, in practice, such datasets with independent features are rare.
The naive Bayes classifier, implemented in Orange's Naive Bayes widget is a method of classification. To illustrate how it works, we can use a dataset that pertains to the passengers of the Titanic, and which records the outcome of its 1912 disaster. This dataset, which we can obtain by using the Data Sets widget, includes information on 2201 passengers, such as their travel class (first, second, or third class, or crew), age, and gender. All of the features in the dataset are categorical. For instance, the age feature simply indicates whether a passenger was a child or an adult.

The structure of the naive Bayes models can be visualized and explained using the Nomogram widget. The widget consists of a scale labeled "Points", a section where the point value of each feature value can be determined, and a scale with probabilities where individual points are summed up and transformed into a probability of the target class. In the upper left corner of the widget, you can set the "Target class" to either "Yes" or "No". If you set it to "Yes", the widget will show you the probability that a passenger survived.
In probability theory, individual contributions should be multiplied to calculate joint probabilities. However, nomograms work in a log-space where a sum is equivalent to multiplication in the original space. By summing up the contributions of all feature values in the log-space, nomograms can bypass the need for multiplication and convert the sum back to a probability in the original space.

The Titanic nomogram shows that gender was the most influential feature for survival. If we move the blue dot to 'female', the probability of survival increases to 73%. Moreover, if that female passenger also traveled in first class, her probability of survival would be 90%. The bottom scales demonstrate the translation from feature values to probability estimates.