Data Mining @ BCM
Part 4: Classification
This textbook is a part of the accompanying material for the Baylor College of Medicine's Data Mining course with a gentle introduction to exploratory data analysis, machine learning, and visual data analytics. Throughout the training, you will learn to accomplish various data mining tasks through visual programming and use Orange, our tool of choice for this course.
These course notes were prepared by Blaž Zupan and Janez Demšar. Special thank to Ajda Pretnar Žagar for help in the earlier version of the material. Thanks to Gad Shaulsky for organizing the course. We would like to acknowledge all the help from the members of the Bioinformatics Lab at University of Ljubljana, Slovenia.
The material is offered under Create Commons CC BY-NC-ND licence.

Concepts Covered
Classification revolves around concepts that deal with learning of the models from the data, estimation of their accuracy, and interpretation of the models to understand their structure and with the gain insight into the patterns in the data:
-
Classification – A machine learning task where the goal is to predict the value of categorical target variable (class) based on input features. A classifier uses the classification model developed from the training data to assign a data instance on its input to a class.
-
Classification Tree – A tree-based model that recursively splits the data based on feature values to create a hierarchical structure for classification. It places the most informative features at the top to maximize class separation.
-
Feature Importance in Trees – As each node of the tree, the algorithm that develops classification tree determines the most useful feature for classification by measuring its ability to create pure class subsets. Methods such as information gain, Gini index, and gain ratio quantify feature importance. These in fact measure the correspondence, or correlation, between a feature and a class in the subset of data instances in the tree's node.
-
Overfitting – A phenomenon where a model memorizes training data instead of generalizing patterns, leading to high accuracy on training data but poor performance on unseen data.
-
Cross-Validation – A resampling technique where data is split into multiple training and test sets to estimate model performance. k-fold cross-validation ensures each instance appears in a test set exactly once.
-
Confusion Matrix – A performance evaluation table that compares actual and predicted classifications, showing counts of true positives, true negatives, false positives, and false negatives for binary class variable, or correct classifications and incorrect classification for multi-valued classes.
-
Classification Accuracy – A simple evaluation metric measuring the proportion of correctly classified instances out of the total. Often misleading if used alone without considering class imbalance, where some class values are represented with many more data instances than other class values.
-
Training Data – The data set on which we train a classification model.
-
Test Data – A data set on which we evaluate the classification model.
-
Accuracy Scoring – A model evaluation process that must always be conducted on an independent test data set. This prevents misleadingly high accuracy caused by evaluating the model on the same data it was trained on.
-
Supervised Learning – A machine learning paradigm where models learn from labeled data, meaning each training instance has an associated target value (class label). Classification and regression are common supervised learning tasks (we will introduce regression in one of our next lecture notes).
-
Unsupervised Learning – A machine learning approach where models identify patterns and structures in data without predefined labels. Clustering and dimensionality reduction, the two types of machine learning techniques we have been covering so far, are typical unsupervised learning tasks.
Chapter 1: Classification
We call the variable we wish to predict a target variable, or an outcome or, in traditional machine learning terminology, a class. Hence we talk about classification, classifiers, classification trees...
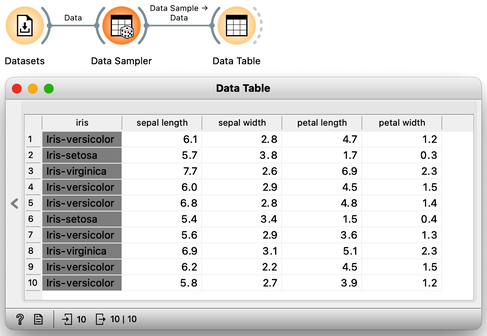
The Iris data set 150 Iris flowers, each of which can be distinguished based on the width and length of their sepals and petals. Although it may be challenging for an untrained observer to differentiate between the different types of Iris flowers, the data set, which dates back to 1936, actually includes three distinct species - Iris setosa, Iris versicolor, and Iris virginica - with 50 flowers belonging to each species. To access the Iris data, one can utilize the Datasets widget. Presented below is a small excerpt of the Iris data set:
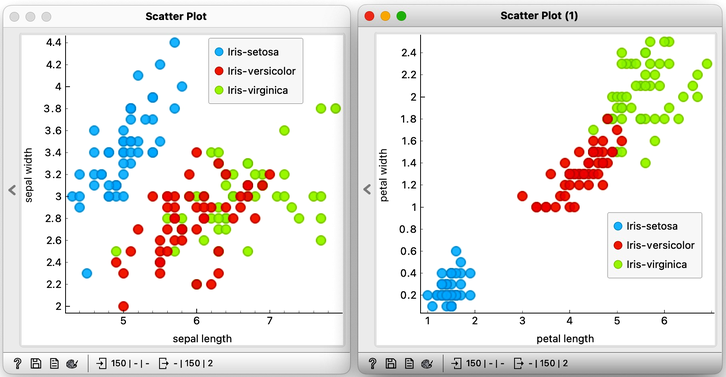
Let's examine the Iris flower data using a scatterplot, with two distinct projections. It's evident that the combination of petal and leaf measurements creates a clearer separation of the three classes. This separation is so distinct that we could potentially use a set of rules based on the two measurements to predict the species of Iris.
Speaking of prediction, classifying the flowers into one of the three species is precisely what we want to accomplish. Imagine visiting a flower shop, taking the flower's measurements, and then using them to determine its species. This would be an impressive feat, transforming even regular customers into knowledgeable botanists.
A model that uses the morphological characteristics of the Iris, such as sepal and petal measurements, to classify the species of Iris is known as a classification model. The Iris flowers in our data set are classified into one of the three distinct categories, and the task at hand is classification.
To create a classification model, we feed the data into the Tree widget, which then infers a classification model and transfers it to the Predictions widget. Unlike previous workflows where the widgets mostly communicated passed data tables to each other, there is now a channel that carries a predictive model. The Predictions widget also receives the data from the Datasets widget and uses the model on its input to make predictions about the data, which are then displayed in a table in the "Tree" column. Visible are also inferred probabilities of each of the three classes.
Something in this workflow is conceptually wrong. Can you guess what?

How correct are these predictions? Do we have a good model? How can we tell? But (and even before answering these very important questions), what is a classification tree? And how does Orange create one? Is this algorithm something we should really use? So many questions to answer.
Chapter 2: Trees
Classification trees were hugely popular in the early years of machine learning, when they were first independently proposed by the engineer Ross Quinlan (C4.5) and a group of statisticians (CART), including the father of random forests Leo Brieman.
In the previous lesson, we used a classification tree, one of the oldest, but still popular, machine learning methods. We like it since the method is easy to explain and gives rise to random forests, one of the most accurate machine learning techniques (more on this later). What kind of model is a classification tree?
Let us load the iris flowers data set, build a classification tree using the Tree widget and visualize it in a Tree Viewer.

We read the tree from top to bottom. Looks like the feature "petal length" best separates the iris species setosa from the others, and in the next step, "petal width" then almost perfectly separates the remaining two species.
Trees place the most useful feature at the root. What would be the most useful feature? The feature that splits the data into two purest possible subsets. It then splits both subsets further, again by their most useful features, and keeps doing so until it reaches subsets in which all data belongs to the same class (leaf nodes in strong blue or red) or until it runs out of data instances to split or out of useful features (the two leaf nodes in white).
The Rank widget can be used on its own to show the best predicting features. Say, to figure out which genes are best predictors of the phenotype in some gene expression data set, or to infer what socioeconomic feature is most related to country's well-being.
We still have not been very explicit about what we mean by "the most useful" feature. There are many ways to measure the quality of features, based on how well they distinguish between classes. We will illustrate the general idea with information gain. We can compute this measure in Orange using the Rank widget, which estimates the quality of data features and ranks them according to how informative they are about the class. We can either estimate the information gain from the whole data set, or compute it on data corresponding to an internal node of the classification tree in the Tree Viewer.
The following example uses the Sailing data set, which includes three features and a class. The data set observes, say, a friend who likes to sail. Suppose that every Wednesday, we ask her what kind of boat she has available and the size of the company that will join her, look at the weather forecast, and then record if she went sailing during the weekend. In the future, we are intrigued to predict on Wednesday if she will go sailing. We would also like to know which of the three features bears the most information about the prediction. Here is the workflow where we use the Rank widget on the whole data set and the data sets that are intrinsic to every note of the classification tree to check if the chosen variable in that node is indeed the most informative one.
Try to assemble this workflow, open the widgets, and select any of the internal nodes of the tree from the Tree Viewer. Check out the resulting changes in the Rank (1) and Data Table (1).
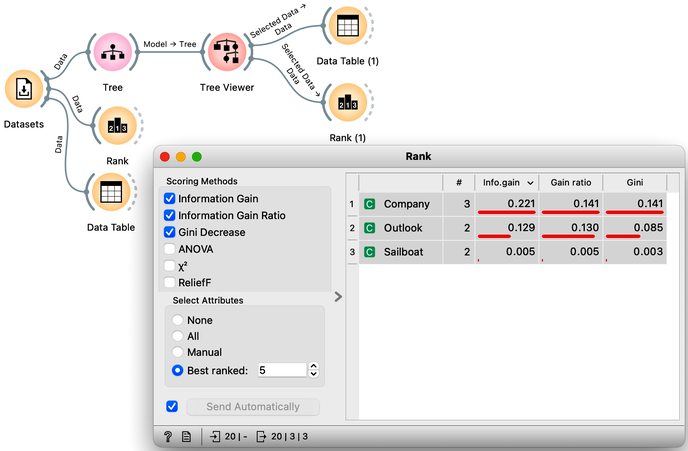
Besides the information gain, the Rank widget displays several other measures, including Gain Ratio and Gini index, which are often quite in agreement and were invented to better handle discrete features with many different values.
Note that the Data widget needs to be connected to the Scatter Plot's Data input and Tree Viewer to the Scatter Plot's Data Subset input. Do this by connecting the Data and Scatter Plot first.
To explore the tree model further, here is an interesting combination of a Tree Viewer and a Scatter Plot. This time, we will again use the Iris flower data set. In the Scatter Plot, we can first find the best visualization of this data set, the one that best separates the instances from different classes. Then we connect the Tree Viewer to the Scatter Plot. Data instances from the selected node of the Tree Viewer, flowers that satisfy the criteria that lead to that node, are highlighted in the Scatter Plot.
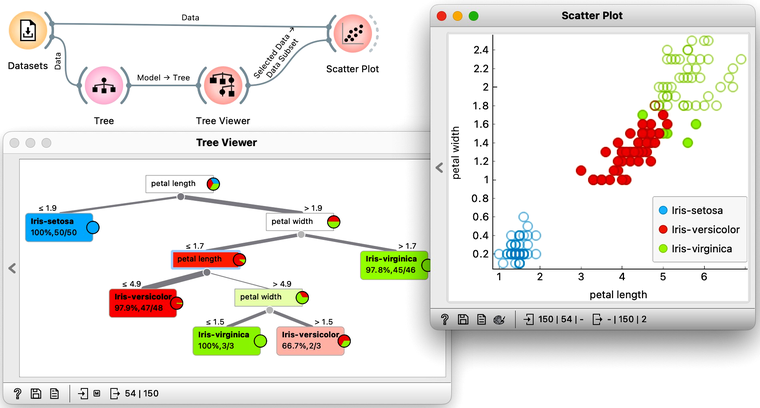
We could include a few other widgets in this workflow for fun. Say, connecting the Tree Viewer with a Data Table and Distributions widget. Or connecting it to a Box Plot, but then rewiring the connection to pass all the data to it and sub-grouping the visualization by a feature called "Selected". Like below.

In a way, a Tree Viewer behaves like Select Rows, except that the rules used to filter the data are inferred from the data itself and optimized to obtain purer data subsets.
Chapter 3: Accuracy
Now that we know what classification trees are, the next question is what is the quality of their predictions. For beginning, we need to define what we mean by quality. In classification, the simplest measure of quality is classification accuracy expressed as the proportion of data instances for which the classifier correctly guessed the value of the class. Let's see if we can estimate, or at least get a feeling for, classification accuracy with the widgets we already know, plus with a new widget that displays so-called confusion matrix.

Let us use this workflow with the Iris flower data set. The Predictions widget outputs a data table augmented with a column that includes predictions. In the Data Table widget, we can sort the data by any of these two columns, and manually select data instances where the values of these two features are different (this would not work on big data). Roughly, visually estimating the accuracy of predictions is straightforward in the Distribution widget, if we set the features in the view appropriately. Iris setosas are all classified correctly, and for the other two species there are just three misclassifications. Classification accuracy is thus (150-3)/150 = 0.98, that is, our tree classifier is 98% correct. This same statistics on correctly and incorrectly classified examples is also provided in the Confusion Matrix widget.

Chapter 4: How to Cheat
This lesson has a strange title and it is not obvious why it was chosen. Maybe you, the reader, should tell us what this lesson has to do with cheating.
At this stage, the classification tree on the Iris flower data set looks very good. There are only three data instances where the tree makes a mistake. Can we mess up the data set so bad that the trees will ultimately fail? Like, remove any existing correlation between features and the class? We can! There's the Randomize widget with class shuffling. Check out the chaos it creates in the Scatter Plot visualization where there were nice clusters before randomization, and where now, of course, the classes have been messed up.
Scatter plot of the original Iris data set the data set after shuffling the class of 100% of rows.
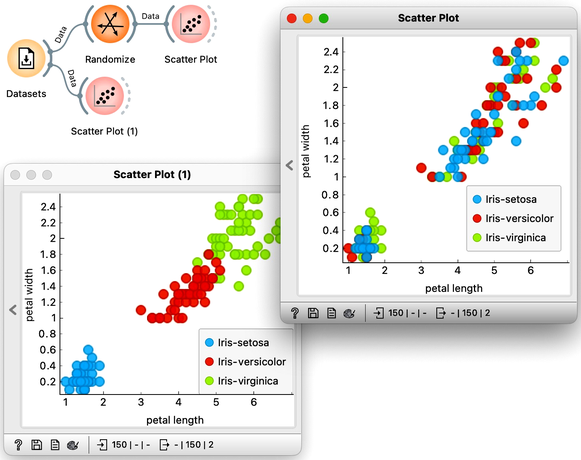
Fine. There can be no classifier that can model this mess, right? Let us check out if this is indeed so.
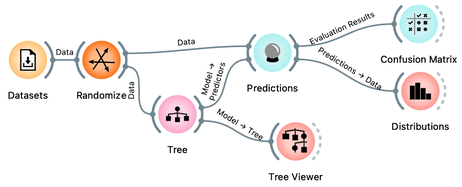
And the result? Here is a screenshot of the Distributions widget.
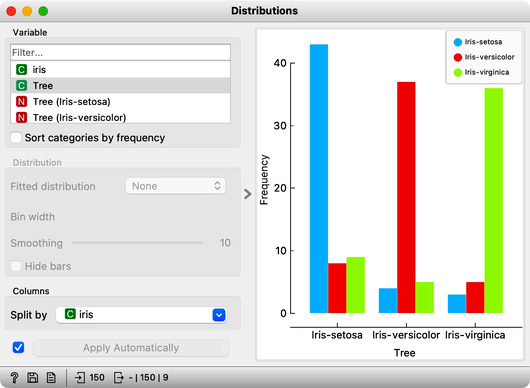
Most unusual. Despite shuffling all the classes, which destroyed any connection between features and the class variable, about 80% of predictions were still correct.
Can we further improve accuracy on the shuffled data? Let us try to change some properties of the induced trees: in the Tree widget, disable all early stopping criteria.
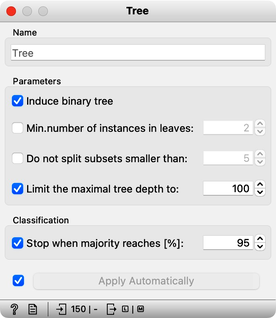
Wow, almost no mistakes now, the accuracy of predictions is nearly 99%. How is this possible? On a class-randomized data set? To find the answer to this riddle, open the Tree Viewer and check out the tree. How many nodes does it have? Are there many data instances in the leaf nodes?
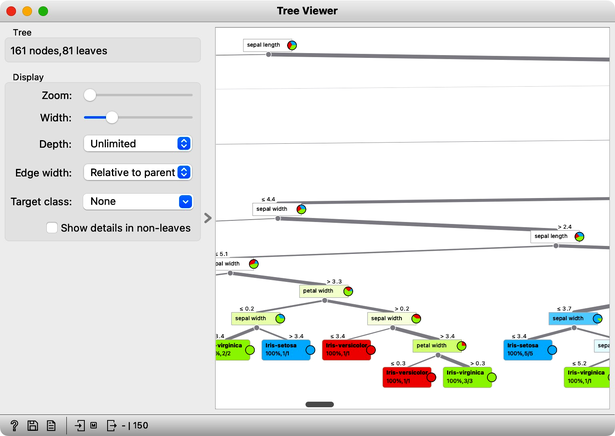
With 161 nodes and 81 leaves the tree is huge and it is impossible to visualize it in a modest-size window. It is perhaps even more complex than the Iris data table itself. Looks like the tree just memorized every data instance from the data set. No wonder the predictions were right. The tree makes no sense, and it is complex because it simply remembered everything.
Ha, if this is so, if a classifier remembers everything from a data set but without discovering any general patterns, it should perform miserably on any new data set. Let us check this out. We will split our data set into two sets, training and testing, randomize the train and feed it into the classification tree and then estimate its accuracy on the test data set.
Notice that we needed to rewire the connection between Data Sampler and Predictions, so that remaining, out-of-sample data is feed to Predictions.

Let’s use the Distributions widget to check how the classifications look like after testing the classifier on the test data.
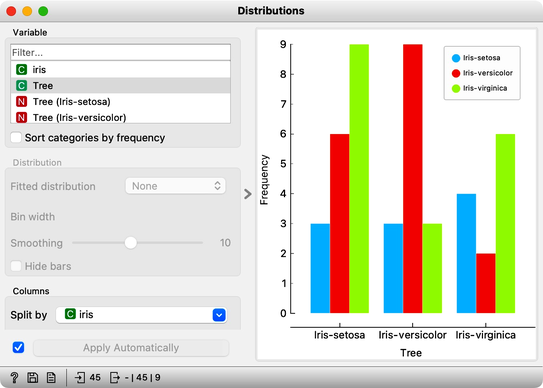
The results are a complete fail. The tree almost predicts for almost equal frequency that the Iris is setosa, regardless of original, true class. On the class-randomized training data our classifier fails miserably. Finally, just as we would expect.
We have just learned that we need to train the classifiers on the training set and then test it on a separate test set to really measure performance of a classification technique. With this test, we can distinguish between those classifiers that just memorize the training data and those that actually learn a general model.
Learning is not only memorizing. Rather, it is discovering patterns that govern the data and apply to new data as well. To estimate the accuracy of a classifier, we therefore need a separate test set. This estimate should not depend on just one division of the input data set to training and test set (here's a place for cheating as well). Instead, we need to repeat the process of estimation several times, each time on a different train/test set and report on the average score.
Chapter 5: Cross-Validation
So how would the right estimation of the accuracy of the tree classifier look like. In the previous chapter, we have learned that we need to split the data to training and test set, that is, we need to test the model on the data that the model has not seen in the testing phase. Else, it is just as we would always accurately predict yesterday's weather. Let us do so without randomization, and set the tree parameters back so that they enable some forward pruning of the tree.
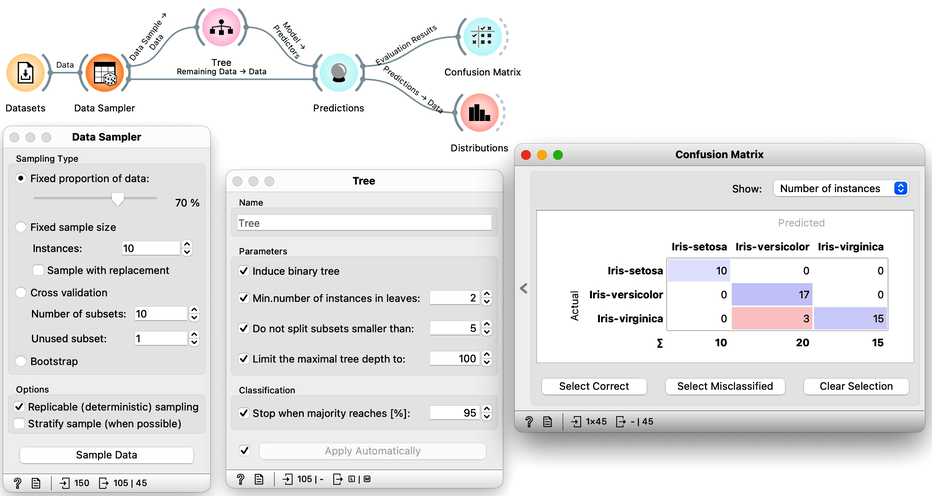
It looks like our classification tree indeed has high estimated accuracy. Only three iris flowers were misclassified. But this estimate can depend on the random split of the data. Let us check this out. In the Data Sampler, we will uncheck replicable sampling, click, perhaps several times, the Sample Data button and observe if there are any changes in the confusion matrix.
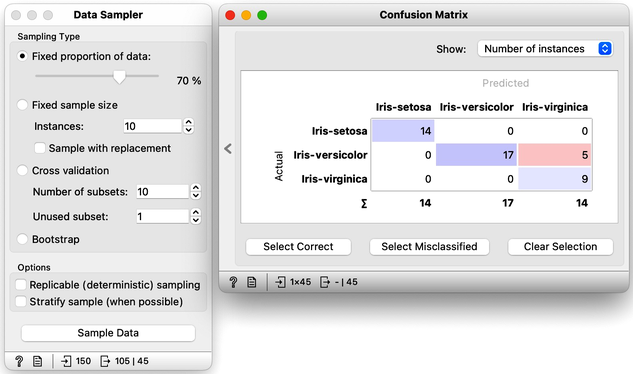
On every click on the Sample Data button, the widget emits the new random sample, and the confusion matrix changes. The number of errors is small, and usually fluctuates between misclassifing versicolor and virginica. If we are really lucky, the composition of the training and test set is such that the tree inferred on the training set makes no errors on the test set.
So if we are about to write a paper on the utility of the machine learning for some data set, which error would we report? The minimal one that we obtain? The maximal one? Actually, none of these. Remember, the split of the data to the training and test set only provides means to estimate the error the tree would make if presented a new data set. A solid estimate would not depend on particular sampling of the data. Therefore, it is best to sample many times, like 100 times, and report on the average accuracy.
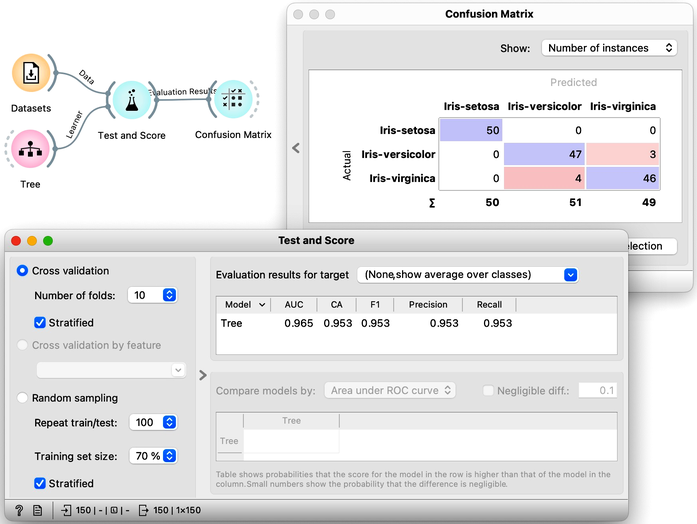
Pressing Sample Data button a hundred times and computing the average score would be really boring. Instead, Orange has a widget that does all that for us. The widget is called Test and Score. To repeat training and testing 100 times with the same training algorithm, we have to provide it a data set and the training algorithm. The widget then iteratively splits the data, uses the training algorithm to develop a predictive model on the subset of data for training, uses the resulting model on the test data and calculates the accuracy, and at the end reports an average accuracy (column called "CA") from all the iterations.
The Test and Score uses the training algorithm, not a model. Hence, the Tree widget sends it the Learner, an object storing a learning method. Why is there no connection needed between the Datasets and the Tree?
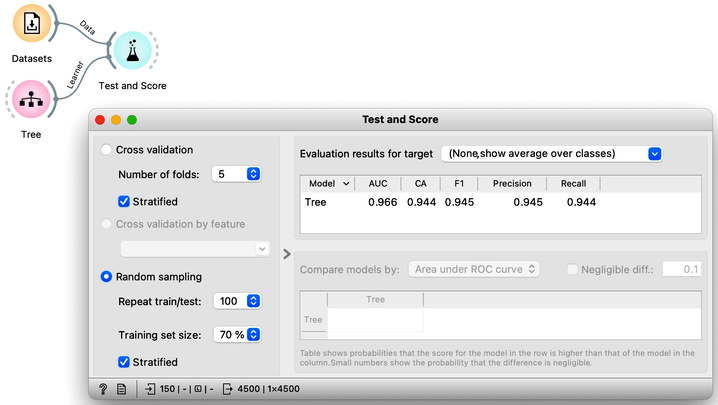
While we could conclude our discussion at this point, there is an alternative and more widely-used method for estimating accuracy that we should consider. This method, called cross-validation, avoids the possibility that certain data instances will be placed into the test set more frequently than others by randomly splitting the data multiple times. Instead, each data instance is included in the test set exactly once. To perform cross-validation, the data is first divided into k folds. Then, in each of the k iterations, one fold is used for testing while the remaining folds are used for training. Typically, k is set to 10, but in Orange, the default value of 5 is used to conserve computing resources. The results of performing ten-fold cross-validation on the Iris flower data set are shown below. To ensure that each fold contains a roughly equal distribution of classes, the "stratification" option is utilized during the creation of the folds.
Another advantage of using cross-validation is that the resulting confusion matrix includes each data item from the original data set exactly once. Namely, the confusion matrix displays the performance results for each data item when it was used in the test set.
